
¶ Podcast Introduction and Sponsor
Chat with Traders is brought to you by Trade the Pool. Did you know that every decade the market reinvents itself? Online brokers opened the doors, mobile apps made trading seamless, and commission-free trading erased barriers. Now a new era has begun. Meet, trade the pool, limited risk trading. And now you also have unlimited time to reach the profit target. From now on, your trading risk is capped, and your trading opportunities are limitless.
Trade the pool funds home-based stock traders with up to$200,000 in buying power. That means you can trade larger positions and scale your strategies without risking your own savings. It's time to trade with more capital, making it truly worth your time and effort. Ready to trade the pool? Click the link in the description and join the stock trading revolution today. Ikea presenterar Ljud av förändring. Tack, hej då!
Es que no. Som Nadinammeriter gav resultat, och hobbyrummet ska bli hemma konter. Välkommen till IKEA! Trading in the financial markets involves a risk of loss. Podcast episodes and other content produced by Chatwith Traders are for informational or educational purposes only and do not constitute trading or investment recommendations or advice. You know, one of the biggest jokes I see is people will be promoting their their system or their model or their
quant chorus or whatever it is, and they'll say, you know, it, you know, takes the stress out of trading. You know, you've got the signals. You you you don't have to worry about it. It makes this like it makes it so easy on you. And Guess what? Like if you're losing, it still feels like you're losing. And if you're winning, it still feels like you're like you get a bunch of losing trades in a row, it feels like you're never gonna have another winner again, right?
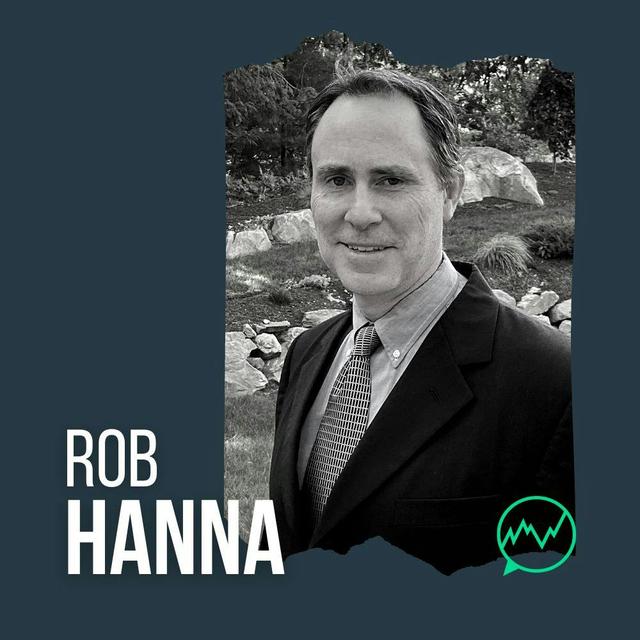
¶ Rob Hanna's Quant Trading Journey
This is episode two sixty-nine on Chat with Traders. It's Tessa, your co-host. When I hear the words quant trading, it's like I have this instant, automatic resistance to it. I think because it just sounds intimidating, complex, abstract, and so much crazy work. I would think to myself Trading the regular way is challenging enough. Imagine what it would take to become a quant trader. Well, if it were easy, everyone would become one, right?
Well guess what? This episode is especially dedicated to the Quant and Quant Curious Traders and you may want to take some notes because Ian has done a great job extracting valuable insights from our guests today. Our guest is Rob Hanna. Rob is regarded as one of the prominent industry swings, overnight, and quantitative researchers.
He has been known for his approach of evaluating market conditions and price action using uncorrelated systems. If I did my numbers right, Rob has been using quantitative analysis in his trading for at least fifteen plus years.
of the twenty two plus years of his trading career. We have included more information about Rob and his work in the episode show notes on the Chatwith Traders website. After being laid off in two thousand one, Rob became a successful discretionary full time trader until the shock of his first major losing year in two thousand four. This was the event that propelled Rob to find quantifiable statistical edges that would help smooth out his equity curves.
Knowing the dangers of curve fitting and trying to find that perfect system, Rob zeroed in on simpler approaches that would combine seasonality, overbought, oversold, and Federal Reserve days. The result is a system that helps minimize anxiety and drawdowns while keeping him invested for the bulk of bullish moves. Ladies and gentlemen, we're so pleased to present Mr Rob Hanna from Massachusetts. Well Rob, welcome to Chat with Traders.
Thank you so much. I've been looking forward to doing this. I've listened to your podcast for a long time actually. And uh Tessa uh reached out to me. I was I was like, oh wow, this would be really neat to do. So I'm excited to be able to talk to you with you. Yeah, great. Great to have you on.
¶ Early Life and Wall Street Internship
Why don't you uh share with us a little bit about your background? I went to uh I I went to Boston College. I grew up in New Jersey and then I went to uh to to B C. and I studied economics uh through the business school. There was actually economics was offered uh both in the uh arts and science school and the business school. And I uh I initially got admitted to arts and science and then I decided to transfer to business.
Primarily to avoid the language requirement. I didn't have to take a foreign language if I transferred to business. So that was my lazy way of switching.
to to the to the business uh school. I've always been interested in the market. You know, even when I was, you know, in in in high school. Um I never traded uh when I was that young, but You know, I remember watching uh movies and TV and and you know, seeing the market on and and hearing about, you know, I had some I live in New Jersey, so I had several family friends.
Uh we were about 45 minutes to an hour from New York City. So they worked on Wall Street. Uh they all did well for themselves and uh it seemed like uh an exciting profession. So it was something I I I thought about. And then when I was in college. I had an internship on Wall Street at uh at Garving Guy Butler where they traded Fed funds. It was like an open outcry pit basically.
And there was a giant marker board on the side and they had a little elevated ramp that you would stand on, or I would stand on. And the group brokers would all yell out their bids and offers and I would have to update the marker board, erasing them and putting writing the new bids down. Uh and that was my my summer internship. And it's it uh Little funny story about that is
My first day there, I mean, I was pretty good in math. Uh I was I was almost strong in math. So right, I I came in. The first question those get the brokers had for me was, well, How are you with math? And I said, Fine. They're like, How are you with your fractions? I'm like, uh
Yeah, I know my fractions. And they're like, yeah, sure you do. Go sit in the corner. You don't know your fractions uh when you got 40 brokers all screaming at you and you got to know where to put which fraction between what fractions. So go sit in the corner and learn your fractions. Uh by sixty four.
And I spent the first day sitting in the corner, learning my fractions, reviewing them, making sure I knew that, you know, five 30 seconds versus uh seven uh 64ths and uh and all that, which was uh which was higher when I was getting screened at. Wow. So uh that was back in the the day, when was that? Uh ninety? That was nineteen ninety one? So they traded in fractions back then, uh before before.
And they were all on phones. I mean, nothing was computerized. It was a bunch of brokers sitting at a desk talking on phones to the banks. Most of the trading. happened and it still does, like early morning or late afternoon. There wasn't uh, you know, at at lunchtime most of the people were sitting around and uh it was a lot of quiet and every once every few minutes someone would
say to change a bit or whatever, but that was about it. What do they say about trading? And it still holds true. It's like uh how how whenever hours of boredom boredom followed by uh uh panic, right? Uh and that's especially for day traders. It's not so much like that for me anymore. I don't I don't do uh uh much in the way of day trading. Uh even so it's you know, there's you got nothing going on and nothing going on and nothing going on and then all of a sudden tons hits, right? So
Life in general's like that, right? They say things happen in threes and you know everything's going good and then all of a sudden everything's going bad. And that's uh uh trading's kind of a microcosm of life in that way, I think.
¶ Transition to Full-Time Trading
Yeah. So um how about after your internship, uh after you graduated from school, where did you go to? So I wanted to stay in Boston and um uh we that was in ninety-two. Uh I didn't want to go back to uh New York, New Jersey. So I did odd jobs for a while. And then we I eventually went to Thompson Financial Software, part of Thomson Financial, which later became uh refinitive. which later now is part of London Stock Exchange. But I was there for seven or eight years.
Uh and what I did there is I sold their uh investment software. So it was it was portfolio accounting software that we would sell to large money management firms. And uh they would do all their back office stuff on it. And there was a a trading front end for some places used it, but they'd run their performance reports, they'd do compliance and they'd do accounting on our software. I had to get into these
institutions and learn about their business and figure out how our software would would fit in with them. And at that time I became real interested in trading and I started doing it myself. So I started with some simple uh with a kind of a combination. You know, I I read the William O'Neill stuff and I got into the you know, I I would do I B D and and look for breakouts and and uh trade in that manner. And at the same time, I was also learning uh day and swing trading techniques.
Um, this was mid to late 90s. Larry Connors site was called Trade Hard at the time. It later became Trading Markets. And that was my first kind of intro to some of the players. There I I liked uh Larry and his work and Dave Landry and his work. and uh and Jeff Cooper. And so I would I would look for setups that I found that I learned from them. And then I would trade those setups each day and hold them, you know, either for the day or for uh for a few days.
So you were reading the Investors Business Daily publication, is that right? Then you were you using the the canned slim method? Exactly. Uh-huh. So what is that? Uh t tell us for the listeners. Uh, I can't remember right now what the acronym stands for, but it's basically uh the method that William O'Neill made famous and he uh tracked in an investment business daily, and it looks to trade high.
quality stocks, high growth stocks that are breaking out to new highs. And he looks at certain patterns, uh, like he uses a cup and handle technical pattern or you know, a high tight flag or flat breakouts or you know things like that where or uh a flat base, excuse me, um where you you wait for a Stock to hit a new high and break out of a basing formation, and then you hope that it's in an uptrend.
There was an uptrend is emerging. And so you look to ride that trend for a period of uh days or weeks or months. And so I traded that and I I traded that in conjunction with a lot of shorter term methods. So like Jeff Cooper in his book had these little sell-ups. He would call'em like funky little names like Gilligan's Island or uh Turtle Soup or you know uh
silly names like the lizards. And uh I'd look for those kinds of setups as well. And one of the things I found is that some of the best swing trades actually occurred in the strongest trending
Stocks. So a lot of times I was kind of trading around my can slim positions and it seemed great for a while. Uh of course you did anything in the late nineties stock market. As long as you're going long, you were pretty much a genius. So My method worked very well for a while, as did most everybody's at that time.
Um, so was there any distinction between the uh investor business daily approach compared to the shorter term trading approach? And was there one that was did you find in retrospect that was more effective than the other uh during that time period? Well the the investors business daily was more of a a slower approach, right? So uh and it also it had low probability win rate. Now it didn't need a high win rate. So
I would uh I could do very well being right on let's call it fifteen percent. I I think I measured it out to somewhere between twelve and fifteen percent of my trades actually went on to be sizable winners. But the rest. were mostly scratches, right? So uh I'd buy the breakout, it wouldn't work, it would kind of come back to where it started or a little below there, wherever my stop point was. And I'd move my stop up pretty quick with them a lot of times.
And so I'd scratch the trade and I'd end up scratching, scratching, scratching. And then once in a while, you'd hit a winner. And it only took a few winners a year. Um, you know, if you're making a fifty or a hundred percent in a in a position to to really matter. The day and swing trading methods I utilized had much higher win rates, but of course, you know.
We were making a few points in a stock rather than uh 50% or something like that. You're only holding on to it for a few hours rather than a few months. So uh you were doing this uh while you were working a full time job? Yeah. I see. Did did you uh later transition to full time trading?
Yes. So uh yeah, around the end of two thousand I left Thompson Investment Software and I went to BMC Software and I sold their software for a little while. I wasn't very happy there. I knew I wanted to be a trader. And so I had a friend who worked with hedge funds setting them up. And he basically gave me the documentation I would need if I wanted to set up my own fund.
What I did is I set up a fund and I established it in August of 2001. And it was just, it was my money and uh a little bit of my parents'. It it wasn't a lot of money, but it just had it was set up as an LLC, uh, or set up as an LP, which was managed by an LLC. Uh so it had a hedge fund structure. Uh and it was just so that I could really be able to show a performance record um and then look to grow it out, you know, later on. Uh I was still working uh at BMC at that time.
Then 9-11 happened, and uh there were big layoffs at BMC like a month later, and I was part of those layoffs. And I said, you know what, this might be my opportunity to become a full time trader. And so that's kind of where I started. It was uh getting laid off that got me my full time trader position. Right. So uh did you continue with your strategies that you had uh cultivated um sometime, some years earlier with the same type of strategies and just worked with that?
¶ 2004 Loss and Quant Shift
Yes. So that I did that for the next few years. And two thousand one, two thousand two were all, you know, bear market years. They were tough. And uh and then two thousand three was a a bull market year. But I did well in all Uh, you know, I was I was good at uh staying out of the market uh during much of the bear market and taking shots with some shorts and and and making money there. My swing trading methodologies were doing pretty good. So I was scratching out decent gains.
I was making money when everybody else was losing it. So so that was pretty good. And then in 2004, that was my first real tough year. Like I said, I was trading a lot of can slim type stuff. And what happened in that year was a very rotational market. So, you know, energy stocks would would break out and then uh a few days later they'd collapse back into their base and you'd see uh tech stocks break out and then they'd fall back into their base and then
uh you know, consumer discretionary would break out. And so I was taking a bunch of stuff and getting churned and and and completely chopped up. And that was my first down year. I wasn't Down a whole lot, but it was frustrating because now I'm a full time trader, right? So if you don't make money for a year, that's tough. Mm-hmm. And so that led me to kind of rethink a lot of what I
had learned and and re-look at methods and look at the weaknesses in my approach. And I was good at riding the trend when I was able to capture it. What I was not good at was picking tops and bottoms.
¶ Developing Quantitative Methods
Right. So uh I was always over invested at the top, right? Because we were riding the uptrend. And I was only always underinvested at the bottom because I or I was partially short and the bottoms were even more severe. So I I began doing the first of my quantitative research and I
studied uh bottoms and how they formed. And I did it with uh, you know, I looked at long, long as long a charts as I could find for the S P five hundred, for the Dow, for uh the NASDAQ, and then any of the uh uh you know sectors. So I I looked at um sectors going back a long time as well. And I devised I I started researching and and that kind of led me to starting to develop a quantitative method, right? So from that research, I developed
some models, some that I still make trades in today. And they do a good job of picking bottoms. Anyone that's followed my work has probably seen me talk about the my capitulative breadth index. uh what I call my catapult system. That was something that came out of this initial research in in well maybe it was a couple of years after that. It was around two thousand five or so that I was two thousand six that I was s really starting to to get into all right, how do we
How do we take advantage of these big reversals off bottoms? Because my thought was if I had a method to take advantage of that reversal, I already had a method to to do the trend and and so forth. So that's um I was trying to fill the holes at that point in time.
¶ Quant Trading Psychology Evolution
I see. So up until that point you were a discretionary trader, is that correct? Correct? Yeah. Yeah. And uh, and so you had quite a few years of success under your belt. Were there any did you feel that um the 2004 experience was? Kind of unfixable, or did you get into quantitative research as a way to supplement your discretionary trading?
Initially I did it as a way to supplement it. Yeah. It wasn't that uh I thought my entire approach was broken, but I wanted to be able to, you know, fill in the gaps in my trading. And so so that's what I was initially looking to do. So how were the first few years of being a quad trader? The methods I used to trade individual stocks and and like that catapult system did very well from the start. But then I had other methods that that didn't do nearly as well.
So it was a little bit of trial and error back then. I was still learning how to design a system without overoperation. Right. So I you don't want to say, hey, you know, this is this is an approach that would have worked on this chart in the past. And now how do I get rid of the the bad trades? Like that's the worst way to to try and build a system.
And that was kind of my thought initial uh early on was well, how do I get rid of these bad trades? Really, you want the bad trades to be in there so you can see what the potential downside is of using a a system. So research, once I figured out research was more for learning about market tendencies than it is the uh trying to find the holy grail, that helped me an awful lot. Mm-hmm. Were you a programmer prior to becoming a quant?
So I took Fortran in high school. I don't know if that's still a language, but um uh I learned how to program in Trade Station. I basically, you know, read what was a trade station. easy language book at the time and started messing around in TradeStation and it kind of came back to me a little bit at that point like how to progress so how to think through writing a program. And I later learned that easy language was based on Fortran. So it was easy for me to kind of start to learn how to do it.
And so that was that was something that, you know, I I'm I'm still a hack at programming, but now I'm a hack in numerous languages, I guess you'd say.
¶ Quant as Next-Gen Technical Analysis
I've read in some of your publications you say that uh quant analysis is the next generation of technical analysis. Explain for that a little bit. Well, uh so technical analysis is basically looking at uh chart patterns, right? So whether you're looking at uh support and resistance or whether you're looking at uh what volume might mean on certain bars or
what you know, what it means when you're oversold or overbought. You need to be able to read a chart, uh, or at least describe a chart. So if you look at a chart, you need to you need to understand the chart, right? So Hey, we opened at the low, we closed at the high today.
Uh and we did it on uh big volume and uh we did it and we closed at the you know the highest price of the last two weeks, but we're still in a long term downtrend. Whatever you need to be able to describe what's happening. Um and a quant approach basically takes allows you to test all those patterns that candlesticks and and other technical analysis type of uh approaches look at. So
If uh well, just the the the the simple things that I look at. So or a few days ago I was looking at uh you know what happens if we have uh three down days and we close at a 10 day low and we're above the 200 day moving average. That's all something that you look at a chart and you see on a chart. And then I use a computer to describe that and say, all right, what's happened over the next one, two, three, four, five days, whatever, every time we've had that setup in the past.
¶ Quantifying Market Patterns and Setups
So it's a matter of looking at the chart, describing the setup to yourself. Amen. seeing if it means anything moving forward. And sometimes it does and sometimes it doesn't. I see. So before uh one gets into uh quantitative analysis, uh sounds like you highly recommend getting very well versed in technical analysis uh first, because that is the bedrock uh of which quant analysis is based on.
Yeah. And you don't have to know uh necessarily, you know, what each pattern supposedly means because you're gonna go out and try and figure that out yourself, right? But you do have to be able to identify moves in the market, you know, it it's nice to be able to test, you know, all the candlesticks, uh, for instance. Typically pretty easy to test if you put you know reasonable parameters around.
Uh a lot of things that are in technical analysis are a little vague. And so I try and make things less vague. I I did it so for instance, the whole idea behind Investors business daily and the can slim methodology is you're you're buying strong stocks that are breaking out and you're looking to to get to to capture an uptrend. And most of what he teaches, I think, is really good. But the one piece where he doesn't, I believe, teach it well is the M, which stands for market, right?
So one of the things that he looks for is After there's been a decline in the market, uh, he looks for a follow-through day. Right. So that's the market reverses. And then a few days later, there's a uh uh at least a one percent upday on very strong volume. And that's supposed to
give the all clear to start buying breakouts again, according to the book and and the newspaper. So uh I spent a long time studying follow through days and quantifying them. And there's a it sounds pretty straightforward, but it It's not like what how much of a decline do you need before you're looking for a follow-through day?
How uh how strong does the follow-through day have to be? Can it be in any market? Um, what is your definition of success on a follow-through day? Like does the market need to reach a new high? Does it need to go up at least as much as it's already gone up? um how long from the low until the supposed follow through day is is valid. You know, uh I think they said somewhere between four and ten days is best. So I tested that. So these are all little nuances.
that years ago and you can still find it on the blog, uh back in like two thousand eight, two thousand nine, two thousand ten, I was I was testing the concepts of follow through days. Overall I found them to not be terribly helpful in in market analysis. But all the other ideas that or many of the other ideas I did I did find um useful for you know that Willie Mill puts out there. So you certainly can make money buying breakouts and riding trends.
¶ Trade the Pool Sponsor Message
Have you ever watched a stock explode and thought, if only I had the capital, or sat on the sidelines because your account balance felt too small to matter? Good news. With Trade the Pool's limited risk platform, you don't need millions or even thousands to start trading the U.S. stock market. Bypass the PDT and tap into over 12,000 U.S. listed equities. From penny stocks to big caps, ETFs, even the newest IPOs, and short anything you like, with zero locate or hard to borrow fees.
Start your evaluation. Get funded with up to$200,000 in buying power so you can go big without risking your own savings. And now you can also have unlimited time to reach the profit target. It's a game changer. Not ready to trade yet? Trade the Pool offers a free demo and educational resources. Practice on live data, master the platform, and build confidence risk-free before you even pay a cent. Click the link in the show notes to start trading with Trade the Pool's capital.
So were you uh was your objective at the time to create a system that would give you the signals of, for example, go long this, go short that? So that you wouldn't have to spend so many hours on the screen every day looking at every tick like is so common with uh with many day traders.
¶ Psychological Edge of Quant Trading
Yeah. Um, but I also wanted to have a way to set my market bias. So that was really what I was studying at night. So when I would go you know, I might be long or short a position. And if there was a real strong move against me, let's say, that felt horrible going into the night, right? Um So what I would do is I would take a look at what the market's done, where it's at, and is there a reason for me to still be in this position? You know, uh did the big move against me
signal a a failed setup, uh, should I be getting out right now? Or uh is the upside edge apparently still there or maybe it's even stronger at this point. So that that's the kind of thing that I was trying to understand. And that's that's one of the things I found over the years that quantitative analysis for me has made it easier from a psychological standpoint to trade. Because when I would be in a position, no matter how I felt about it, I'd do my research that night.
And then I could say, all right, you know, today was a bad day, but it looks like uh we're likely to turn in the next few days. So I gotta hold on to this position still. Or the opposite, where, you know, today was a great day. And uh it's unlikely to continue much further than this. Time to get out. So was the quantitative analysis that you were doing acting as like your advisor at the end of the day to help
say, hey, look at this data, you know, the probabilities that it's going to continue the up move or you should get out, uh, what have you. And you were making the trades manually, is that correct? Yeah, so I'd I'd be uh, you know, back then I'd have manual positions. I mean, I still take trades manually, but not discretionarily.
Right. Most of my trading is based off of of of systems these days or models that I've built. So it would it would have let me establish my market bias, not just for those positions. But what's important is for, you know, whatever new positions I'm looking to consider. Right. So Uh and this is something I've done for fifteen years or so and uh still do to this day.
Where, you know, I do my market analysis every night and I want to have a bias going into the next day. Uh and whether that's uh it basically I keep it simple. Am I Short-term bearish, bullish, or neutral. And uh if I'm short-term bullish, I'm only looking for a long position. If I'm short-term bearish, I'm only looking for short positions. And if I'm neutral, I'll I'll look for either, but they they need to they need to have you know a real high probability behind them.
Did the quant information that you would get at the end of each day then act as kind of like you were almost like a psychological uh guide to help you determine whether you're gonna get in or out of that position so that you what did you have to deal less with the regular psychological aspect?
of trading, uh trading mentality because you had this quantitative advisor, so to speak. Exactly. Did you really oh I see. So you did Did you find that um did that help you get around the the psychological challenges of regular trading? Yeah, it helped me greatly. I mean, you you you you kind of start off, a lot of people do with uh maybe a what you call a gambler's mentality, right? And and you you ride the the ups and downs uh like you're at a crap's table, right, right.
Really you you don't want to be a gambler, you wanna be the casino. So by constantly studying the odds, I've been able to turn my trading from being, hey, I was a uh I was a pretty good gambler, but now uh you know, I've always got the odds in my favor, not only massively in my favor, but you know, I know what they are and and um and everything's measured before I go into a trade.
Do are there any uh unique type of psychological or mindset issues that are are unique to quants uh that you still have to deal with? Yes. I mean it doesn't You know, one of the biggest jokes I see is people will be promoting their their system or their model or their quant course or whatever it is.
And they'll say, you know, it it takes the uh, you know, takes the stress out of trading. You know, you've got the signals, you you you don't have to worry about it. It makes just like it makes it so easy on you.
And guess what? Like if you're losing, it still feels like you're losing. And if you're winning, it still feels like you're like you get a bunch of losing trades in a row. It feels like you're never gonna have another winner again, right? And um streaks still feel as bad uh when they're going against you and they still feel as good when they're going your way.
But you've got a I think a little more assurance of yourself. Like you've got a little bit more of a reality check that you know, all right, it's not gonna always be this bad, it's not gonna always be this good. And you can see that in the data.
¶ Algorithmic Trading Misconceptions
I see. Were you ever tempted to uh convert your quantitative approach to also an algo approach so that you wouldn't wouldn't have to deal with any of that? Just let the algo trade for you. Well, yeah. I mean, some of the models that I trade are uh uh basically what you'd call algo models, right? So In fact most everything is these days. So I I don't necessarily let it be a little bit more than a little bit.
drive itself from the standpoint of like none of them are day trading models. So what I do is I'll run the model at night and I'll see what's triggering. And then I double check.
before uh uh a trade is placed. Cause I wanna make sure that, you know, it's not kicking off something odd. So for instance, if if I get a signal to go along some SP 500 stock and I don't look at and I just let the computer go and do it and I don't look at the chart, I may not realize that, hey, that stock just got, you know, that company just got bought out. It's it's really it's just going sideways for the next month or so until the until the merger is complete.
Right. Um so I always want to uh make sure the signal's correct. And, you know, even with um and sometimes the software kicks out a bad signal. You get a bad uh you get a bad tick or something like that. So I don't just let trades flow through. I I always check and then enter my orders manually. I see. Do you think that some people get into quant trading or even algo trading, say for the wrong reasons, like say not wanting to deal with the trading mindset and the psychology?
and the cultivated intuitions and screen time that's often necessary and surrender it to some uh kind of an automated system or a system that's kind of outside themselves. Do you do you ever see any issues with that? Yeah. If you're not, well, you can't push it off to the computer or even to someone else and never worry about it again, right? If if it's not in your personality. And it depends on how big of you know a portion of your portfolio you're pushing off.
It's easy to say, hey, take uh uh, let's take 10% of my portfolio and run with it uh this certain way. But if you're a beginning trader and uh you know you can't divide your portfolio into 10 parts. Uh you just need a model to to start to run with.
Um, then you really should be involved and and learning about it if you have an interest in it. Regardless of what the model is or whether you're trading it or someone else is trading it, you're still gonna live the ups and downs. You're still gonna get excited when it does well and you're still gonna get
disappointed when it doesn't, right? So uh if you go into algo trading thinking, hey, I'm just gonna, you know, push the buttons uh or you know, flip the switch and it's gonna make a bunch of money for me. You're going to get disappointed. And if you don't know what's behind the system, if you're not certain what the system is based on, if it's not true edges that that it's looking to take advantage of, um, then that'll bring in even more doubt.
Um, so even if you have a system that's great, it's gonna go through losing periods and you're gonna get scared out of it potentially if you're not confident it's great. So what are the differences and similarities between quantitative and algorithmic trading? Are they essentially the same except for the quantitative is it's still a manual approach that you eventually hit, you know, hit the buy and sell and the algorithmic Trading is taking that same data and automatically trading for you.
I've never made a distinction myself. Okay. So, but yeah, I mean the way we've been talking about it, it it it for me a quantitative approach is just understanding the odds, right? However you want to define that. But I guess uh an algorithmic would be could completely computerized. Right. And I think um uh without that kind of uh without any intervention for pressing the button. Right. So a mechanical system that uh
that that can run itself rather than you having to to run it. I've had algo systems in the past that I set up, for instance, in TradeStation that you know you turn on in the morning and turn off in the when the market closed. And if
To me they're no less emotional and they're no less worrisome, right? If If you get an internet outage or uh the computer crashes or you know, whatever happens, uh you still gotta there's still a million things to worry about with algo as opposed to doing it manually.
¶ Robust Systems and Long-Term Edges
D I'd like to dive into a little bit of the perceived complexity and difficulty of being a quant. Have you estimated how much time you needed to spend over the years, you know, programming, researching, backtesting, and how often potential strategies are thrown out because they're overused by others in the past? Let me break that down. Are you asking how much time I spend?
Yeah, over the years. Um the time that you invested in doing all this research uh to come up with uh various systems and did you how long were you able to use these systems and you know, that whole process. I haven't I don't I haven't thrown out a whole lot of systems over the years that I've uh I mean that's not true. I've I've thrown out a good number, but I rarely tweak system. I go I take a real broad look at the edges I'm trying to identify.
I look at general ways to take advantage of those edges. I make sure that the edge is robust and um I have, you know, I don't want I don't want a system to work with certain parameters and and not others. So um as long as the edge persists, I've been able to continue to trade models for for years. Most of the models I have now
several years old. Um, you know, I mentioned like the catapult system I designed in, I don't know, was it 2005 or so? I still trade it as, you know, as I wrote it many years ago. You know, the way I trade, um I've had a s a few spy systems over the years.
But the ones I'm trading now I've had for four or five years at least. You know, there's a like uh I did a market timing course at quantifiable edges in It's two thousand fourteen and it's a simple course, like you go through it in like an hour and it's more intermediate term, but it's It takes a look at four different indicators, and uh two of them are price based, and two are seasonality based.
And it looks at, oh, you know, is there an ed do these provide an edge and how could we combine them? And I did that in 2014 and then I updated the course. this summer and I I showed how the the models that I did then have continued to perform over the last nine years. And as far as I was concerned, nothing needed changing. Um I did add one more indicator that that's based on Fed liquidity. And and so I created one more system out of that in the in the new version of the course. But
for the most part, you know, if you find an edge that uh is able to persist, it can persist for a a very long time. Now not everything persists forever. So you gotta be able to identify that. But you know, you shouldn't be making a new system every month or every year.
So I imagine the temptation would be uh is to try and find the holy grail of systems to say, oh, what if I f you know, add in this indicator and subtract that one and let me back test it and back test it over different periods of time. So it sounds like uh you've hit on a system that is performing well enough and you have not been too tempted to try to tweak it and retweak it and until you quote get that best system.
Right. Find something that that works pretty good and that you can live with the ups and downs.
¶ Uncorrelated Systems and Diversification
And then combine that with other systems that do completely different things. So, you know, I have a Um I have a few models that I call my uh swing models that I trade for myself and uh and and for clients. I I I'm I'm an investment advisor as po uh in addition to doing uh quantifiable edges. And so I have what I call my swing one hundred, my swing four hundred and my ETF swing. And they're
similar to each other in concept. And but they'll the you know the the swing 100 and swing 400 both trade SP 500 stocks. Right. So Those do that. And then I have another system that trades five. And that is based off of uh, you know, the the the initial swing systems are based off of concepts I I did years ago on, you know. price stretches and we're looking for rebounds, uh, reversion to the mean type stuff. And then
Uh my spy hunter system is based off of uh VWAP. It's a it's a different indicator. And then I have one called uh duration rotation that trades treasury. And I have uh VIX systems. And so I you know, if you if you have systems that are uncorrelated to each other, you know, and then I got the the the the models from the market time, of course I mentioned, right? So that that's more of a trend following.
So if you have systems that are uncorrelated to each other, that's where you get real value. It's not the it's not the perfect system that's gonna make you a bunch of money. But if you have uh several systems that all can be making money at different times or coming then You've got a real edge. And that'll allow you to use leverage as well and still uh maintain a fairly smooth profit curve with uh lower drawdowns than you would have with any individual system.
systems might have 25% drawdowns, but you combine them all and you put a little leverage in them, and the max drawdown might be 15 to 20%. Yeah, I noticed that you have uh uh looks like ten different um systems. Is that accurate? Ten maintain portfolio. So the the the numbered systems are on the quantifiable edges site and those really are just uh they're setups I created long ago and they're very simple that people can They're not like a complete portfolio system, but they're simple setups.
So if w the way um I've traded them in the past is I will publish any triggers that are happening for the numbered systems uh on a nightly basis. And then uh people can go and see what the stats are on um that system.
uh what the stats are for that particular security that's that's been traded. So maybe, you know, Microsoft's done especially well with it over the years and Microsoft's triggering today. Well you can see that. But I generally suggest, you know, you you don't want to you don't want to be looking at long triggers. when the market bias is short. You don't want to be looking at short triggers when the market bias is long.
Those are really just kind of trade idea setups. Those aren't complete systems with risk management, well, uh with position sizing building. I see. How often do you get long or short or exit signals from your system and then choose not to take the trade? if it is one of the models that I trade for for myself and for clients, never Like I'm not I don't override any of them. Okay, so you don't have a I mean there's no problem with second guessing. Um
¶ Avoiding Curve Fitting in Backtesting
No. I see. Uh what what about curve fitting? Uh we often hear about curve fitting when doing back testing. Uh what is this and how can we avoid it? Uh curve fitting is basically It it's it's what uh you know, some people also refer to as o over optimizing. You're you're you're you're trying to find the perfect parameters that gave the best profit curve in the past, right? So let's say you design a system That gives a 20% return over the last uh 10 years, but it's had a 50% drawdown at one point.
Um, someone that's curve fitting might look at that and say, all right, how they say this system looks great. How do I get rid of the drawdown? And right? You want to because you're you're trying to sell the curve to somebody else or you're trying to convince yourself that. Oh, if I just knew how not to let that bad thing happen, you know, then I'd be fine. And it seems reasonable when you're first starting a program, like, all right, how do I get rid of the bad things that happen?
Um but you never know what the b next bad thing that's gonna happen is. So uh someone that's curve fitting will will say, all right, well, what happened in this instance that may not have happened at other times? Uh and then they'll make a Real. to avoid avoid taking any trades when this particular thing happened. So maybe uh, you know, it was right before the flash crash, or right before the crash of 87, or right before, you know, COVID or whatever it was.
And you they they note something that uh happened in a few bars or or on a bar and they say, Oh, well, if I just avoid any time the setup has this trigger. I'll I'll be fine. And those are one off black swan type events. And black swan events happen uh a lot more often than you would think, but they happen in different ways every time. So you fit the curve to the path.
It doesn't help you anticipate what the next real market event is gonna be. You know, is it gonna be, you know, a another COVID? Uh is it gonna be a war? Is it gonna be a a financial crisis? Is it gonna be uh computer virus that's taking over? You know, w
Who knows? There's going to be some kind of a liquidity crisis emerge somewhere, somehow, and you don't know how the next one's going to happen. So if you curve it to the past, you know how to you know you might know how to avoid the COVID crash, but that's not going to teach you how to avoid the next crash.
So when back testing, is there a certain such is there such a thing as an ideal time period to back test? Uh are there significant differences, say, between using five, ten, uh, or twenty year or more periods?
¶ Ensemble Models and Market Analysis
Um and you you mentioned in your documents that uh you like to have an uns an ensemble of data. What is this and how do you collect these uh various different points of data to come up with your your strategy? Okay. So one of the models that I I post on quantifiable ledges and I that I talk about ensembles, I so I'm thinking maybe you're you're uh referring to like the seasonality stuff that I have up there. Yes.
That was that used an ensemble approach. And that's just one way that you can approach testing. Uh effectively, what it does is it takes multiple systems and then combines them into one system or multiple models and combines it into one model. So for instance, the seasonality model might look at might have two models, one that looks at day of month and another that looks at say day of year or week of year.
Right. So you you can you can break seasonality down any way you want, month of year, um, uh week of month. So Uh that's basically what the the seasonality models do, is they say, all right, I have one model that just looks at day of month. I have a second model that looks at uh week of year. And I'm going to run those models independently and take whatever stats come out of those models and then average those stats together to give me my answer.
So the stats would say today's the third day of the month. The market's been up sixty percent of the time on the third day of the month and uh the average day has made uh, you know, point one percent or whatever. we're also in the third week of the year. So the week of year one might say, all right, yeah, uh we're typically down in the third week of the year. And
Uh it's by this much and this percent of the time. And so you take those stats and you you average them together and they might say, oh, it's you know it's neutral. Whereas if they were both saying, hey, we got an edge here, then then you might have a bullish. trigger for an ensemble type model. It's something that they do with like forecasting hurricane.
Right. So they'll have multiple models to forecast a hurricane and then they take the average one and that's where you get the the the track that they have, you know, real wide and then eventually it narrows and narrows as as the models come together, the event comes closer.
¶ Price Action, Breadth, and Fed Days
Yeah. Um so for your system, uh, I understand you also look at uh price action and internal. Yes, so uh I'll look at really anything that I think can
generate an edge. So price action is just looking at um movement on charts, right? So, you know, i and you can measure that with uh indicators like RSI or Bollinger Bands or uh just saying, hey, we were up three days, down three days, or, you know, it's the biggest day up in uh uh in the last two weeks, or we're hitting a high or hitting a low, anything like that, I I kind of throw into the price action.
Fuck it. Right. You can learn a lot from from price action. That's that's my that's number one um when you're looking at designing stock trading systems or trading or systems to trade the indices. And then, you know, I'll look at uh uh whatever else I can find. So volume uh or uh sentiment measures or seasonality measures uh or breadth. Um all of these can clue you in and um
Sometimes they'll be saying different things. You know, we might have real strong seasonality, but lousy price action. So they kind of balance each other out a bit and uh not a great time to trade. But if you've got breadth and seasonality and volume. all telling you at the same time that uh uh we're likely to get a move higher, that's where you really want to press the gas and and jump into a bunch of trades.
You uh some number of years ago you put out a publication on Amazon, quantifiable edges guide to Fed Days. And given given that the Fed Day is tomorrow, what what are your thoughts on um on uh You since the Fed days have statistically shown a positive expectancy, um, what are your what is your take on going long now, um, given that the market has been down a number of days?
Well, in general, when you uh you're right, Fed days have been a positive event. So, you know, come up with any conspiracy theory you want there. Uh right. The chair the chairman wanna look good. Uh so the Fed days are are up um more often than not. And so Fed days uh have been a uh a generally bullish day. Um, what my research has found is that when you have the market doing poorly heading into a Fed day, it's been an even stronger bullish edge.
And when you have the market ramping up and going higher into a Fed day, that's greatly eliminated the bullish edge. It it hasn't become bearish, but it's been kind of neutral. And I looked at it a number of ways. So it might be, you know, hey, are we up a bunch today going into tomorrow's Fed day? You know, that means we might have some front run Or are we down a bunch today going into tomorrow's Fed Day? That means everybody's afraid of what the Fed's gonna say. And so when the Fed Day
occurs if you're not thinking conspiracy theory, then it it could just be, hey, you know, whatever we were afraid of, well, here's reality now and it's not as bad as we feared. And so now the market can Uh can look past it and can bounce a little bit. That's uh one of the reasons I think when you get a sell off heading into a Fed day, you you often get a bounce on the Fed day. Now there's the another reason it might happen is uh and I don't think we see this as much anymore, but in the past.
You know, if if we're in a bad market, the Fed might be trying to calm the markets too. Right. So they'll say something that will allow the market to to rally uh sometimes. And that's, you know, if we're in a real difficult environment. Or they might s be trying to cool the economy at some point and and that will tamp down uh what was the phrase uh Greenspan used? Um Irrational exception. Observerance. Yeah. Yeah.
So they're trying to get rid of irrational exuberance in the market. And uh and so uh when the Fed when when we're overbought headed into a Fed day, it might come down some. So whether it's you know, whether you're looking out over a ten day period or a one day period. Uh a strong move up into a Fed day generally eliminates your edge or or reduces it. A strong move down into a Fed day, uh, there's a good chance you're gonna get a bounce the next day. Now a couple other interesting things about
Fed days I'll share. One is that most of that upside edge actually comes before the announcement. So if you measure from the close of the day before the Fed day. Until two o'clock the next day. That's where the edge is. Everything after that two o'clock announcement is pretty much noise.
uh when you look at it over the long run. So if you're looking to get in because we're selling off head into a Fed day, you don't actually need to hold through the announcement. You can you can get most of the benefit by getting out before the announcement. I see. Um looking at uh a little bit longer term, I noticed that since the market low of last October, the market's up around twenty five percent.
¶ Fed Policy and Market Outlook
But at the same time, the T bill rates have increased from three and a half percent to five point three percent. Uh, is the old mantra don't fight the Fed now dead? I don't believe so. The the Fed um has been raising rates and they've had quantitative tightening going on. since March of last year. So we're still kind of around where we were then. I haven't found a huge edge in rates.
Like going up and down. I have found a bigger edge in looking at liquidity from the standpoint of quantitative easing or quantitative tightening. And that can be measured back to uh two thousand three is when they have the data on the Fed website. Yeah. Looking back over the last twenty years, back to two thousand three, basically all the gains in the market have come when there's been quantitative easing happening, when there's been quantitative tightening, then
We've actually had a slight loss in market value over time. Not very big. Uh, we're better off having the Fed on our side. You know, they just if they're providing liquidity, that finds its way to the market. If they're taking liquidity out of the system, that's going to eventually hurt the market. I have found In my experience that the Fed goes too far with everything also. So
If you think back to two years ago, we had uh the Fed saying we need to get we need to get inflation up over two percent and we need to hold it there for a little while. Congratulations. Nine months later they had it at nine and a half percent. So Right. Right. So they completely overshot to that side. And I think they're, if not already overshooting, going to overshoot any other direction as well. Well, um I mean if overshooting isn't the market's uh current action of just kind of going
sideways mostly, slightly down. Isn't that a good indication that their quantitative tightening is actually just right? Kind of the Goldilocks temperature and that they're not overdoing it. Yeah, so it's good so far. They haven't overdone it yet, but my inclination is, like I said, they tend to overdo everything. So are they going to stop before something breaks? I'm not optimistic of that. What's going to get them to lower rates?
People think that we're gonna have lower rates starting, you know, twenty twenty four. Well, if that's true, what's gonna make'em start lowering rates in twenty twenty four? Slowing economy? If it's slowing a little bit, uh I don't know, probably not. I mean, they're insisting they gotta have inflation down below two percent. So I don't see that we're gonna get it below two percent.
and have the economy slowing just a little bit and they'll dial it back a little bit and things will be hunky dory. I think they'll probably overdo it. Something's gonna break and that's gonna force them to lower rates and try and get the economy. You know, going again. So that's my fear, and that's kind of the experience I've I've seen over the years with you know, when they're trying to get it get the economy hot, they get it too hot. When they try and cool it off, they cool it off too much.
Well, hopefully this time they learn from all their previous mistakes and they just get it just right. Hopefully. The the the I I think the problem is not that necessarily the Fed is dumb, but they they got blunt tools. There's only so much they can do.
Right. And and so, you know, yeah, I I don't I don't blame them for overdoing all the time. Um, but I do uh uh I do think it's an issue and I I wouldn't be surprised if we uh If we saw a uh a recession um not too far down the road, there's a uh now what could pull us out of that? AI, right? We that that's where all the excitement's at. And maybe we get uh uh more excitement there and it becomes the next uh you know, internet bubble.
Uh and that'll eventually break. But There's gonna be events down the road and and uh as traders we gotta prepare for.
¶ Aggregator Line and Market Bias
Yeah. I notice in your weekly newsletter you have what's called an aggregator line, which goes above and uh above into the positive and down into the negative. What are the components that go into the aggregator line to help you help aid you in determining whether you're in a kind of a bullish or bearish environment? So that's just uh the aggregator takes whatever studies I currently have that are active. So when I'm looking to set my market bias.
I uh I I start by just looking at what the market did today. Right. So if I look at the market as we're talking, the SP gapped down, it uh uh Went lower for much of the day. It's been bouncing now. It's uh about uh where it opened, uh, but still lower on the day. So I might
look and say, all right, um uh based on where we well yesterday was an upday. So, you know, we we have an unfilled gap down from an upday and it's a day before a Fed day, but we're closing the top end of the range. I'm just making stuff up.
Um, maybe that's something I find interesting and maybe I say, oh, there's big volume in there, what's happened in the past. So I'll go and and e examine that. Now that might be a new study that uh I look at and I I try and look at um some new things each day. uh if I notice something in the market that's unusual. But I've got about 1300 studies that I've saved that uh I have programmed that will trigger. So uh if they happen again.
And so then what I do is I go back and I i if something triggers that I've studied in the past, my program will pop up and it'll say, Oh, you know, this is happening and last time it happened was uh 2018 and you wrote about it on this day, and then I'll go back and and read it and then uh rerun the study and see okay, it looked like uh based on what I said before it was bullish. Um, does it still appear to be a bullish edge, whatever the pattern is that I've that I looked at?
And if so, I'll include that as a study that I want to, you know, maybe it's got a, maybe it says over the next three days we're up uh, you know, 1%. uh on average. So I'll I'll take that information into account and say, all right, so we should be up about 1% over the next three days based on this small look at the market. All right. Now that's one look at the market, whatever that study is.
I might have five different looks at the market. One might be, hey, we're down three days and it's price action or whatever. And when there might be another one that says, Hey, you know, we we the market was down a bunch yesterday or up a up a bit yesterday, but breadth was terrible. Or we were down a bunch, but breadth was
Um, great. So um each study might last for four or five days. So uh I might have five or ten studies that are active and I might have seven of them that are bullish and three that are bearish or whatever, the aggregator just aggregates my studies. So it says, all right, on average, what's all the evidence saying? And if the evidence is saying looks like we got a bullish
probability over the next few days, then that's what the aggregator line says. The aggregator says, all right, looks like we're probably going to be up over the next few days. And it's just taking those studies into account. Now the other thing I look at is are we overbought or oversold versus where I thought we would be based on the studies for the last few days? If we're oversold and we've got a bullish outlook.
That I look as a favorable environment to to trade in. Favorable outlook, you know, bullish outlook, but we're overbought already. And then, you know, potential rewards not as great there. I see. And overbought and oversold are measured by what RSI? No, uh I just uh so on that same chart I have what I call a differential line. So that measures, you know, if the studies had said.
We're supposed to be up on average one percent a day over the last three days. And over the last three days we were up a half a percent uh rather than one percent, we're oversold. Right. We're we're relatively oversold based on on what the studies are saying. Uh if it thinks we're supposed you know, we were supposed to be up and we're down, then we're really oversold. But if it says we're supposed to be up one percent and we're up two percent, now we're overbought.
¶ Catapult System and VIX Trading
Mm-hmm. I see. Uh one of the systems that you use is called the catapult system, uh, which I think you call it the capitulative breath indicator. Is that accurate? Yep. And is that um what is that? Is that uh looking at stocks that have had a sell off and you're looking for some kind of mean reversion? Exactly.
So uh all the uh I the official breadth index, I just call it CBI for short, that's from the the I mentioned the catapult system earlier that I I designed that like 2014 or or I'm sorry, 2004, 2005. And that looks for stocks that are undergoing extreme selling and uh have been in a in a strong trend already. So it's probably the the end of the sell-off. It's like the blow off. I look for that in S P 100 stocks. So just the biggest of stocks
And the CBI measures the number of triggers that are active at any one time. So when when we have many stocks that are having what looks like uh capitulative selling occurring. Um, that means there's a real good chance that the market as a whole is undergoing perpetual selling and is about to bounce. So the the CBI is something that I look at that really comes into play probably two or three times a year.
Where we get, you know, some strong sell-off that the CBI spikes and all of a sudden it's, you know, hey, we're probably gonna get a bounce you in the next two, three days. Uh how do these CBI readings uh connect to the VIX levels? And do you ever use VIX in combination? CVI is really just looking at individual uh signals in SP 100 stocks. The VIX is something I uh I trade a lot, but it uh it's completely separate research and and and cyber signal.
The VIX is something I would suggest people learn more about. There's a lot of misinformation on the VIX and it's it's There's really large edges around uh trading VIX futures, VIX options, and um VIX ETFs and ETNs. And uh, you know, understanding some of those edges. Um it's probably my favorite uh group of securities to trade um because I I feel the edges are so large. Yeah. Excuse the last interruption here. This is Tessa. We hope you're enjoying this episode so far. If you love the podcast,
Please give Chatwith Traders the best review you can on whatever platform you're listening from. This will help us to keep the episodes coming. Also, if you haven't subscribed to our email list, please hop on to chatwithraders.com and click on subscribe. so we can keep you posted of information that may be of importance. Thank you. Now back to the chat with our guests.
¶ Trader Struggles and Future Research
So to wrap up, uh, what do you struggle with most as a trader? As a trader. Well, what I struggle with most is my time, but um Uh as a trader, I think I've evolved to the point where, you know, um buy and sell decisions are generally pretty easy. Uh I've got a lot of my models built out. Um, you know, there's always more to learn about the market and uh I'm always curious to to find new things uh to trade that are uncorrelated with what I'm already doing.
That's where most of my time goes these days related to research. It's not taking my models that I already have and making them better. It's finding other models that use completely different edges that are uncorrelated. Uh and so how do we do that is is is kind of the the next big i it is always the next big challenge for me these last few years. Um so for instance, the You know, a lot of my victims.
signals that I I use and trade are are based off of um you know the tendency for uh VIX ETFs and ETNs, so the the ones I trade there. There's a negative bias for those over time. The you know, VXX and uh uh and U VXX. And so there's a real short side bias to them and I trade them short, going in and out a lot of the time. Well, is there a way to use Vic securities to trade with a long bias and
uh or long VIX, I guess so uh really use it for protection against uh a portfolio. And that's something I've developed over the last two years. The next time there's a or you know, it helped me a lot last year, right? We saw several big sell-offs during the year and well, mini VIX spikes up into the mid thirties, high thirties.
uh in February when there was the Russian invasion of Ukraine again in you know uh June, again in September last year. And so uh having a model that was able to take advantage of Vic's spike. was something that uh that helped me greatly in in in my trading because I had some other things that were struggling. So Um just finding complementary systems, complementary models, complementary edges is my biggest challenge these days.
¶ Advice for Aspiring Quant Traders
What would you uh suggest to those traders who are interested in taking the next steps in diving into quant trading? Uh, because you know, some may listen to this and say, wow, it feels like a almost like double work and perhaps higher, you know, barriers to entry. Um how much programming do they need to learn? Or if any, I mean, like what kind of off the shelf um software programs are available for new traders to get involved in this? Uh at the end, uh I imagine you feel it's worth it now.
Yeah, if you if you're gonna trade, you have to learn a program because you got to test your ideas. You're you're you're gonna have ideas. And you wanna be able to see how those ideas have worked in the past. And it doesn't have to be you you don't need to be some advanced C plus programmer programming Python or Anything like that. There's there's plenty of uh software out there now where you can I mean that will claim they can you don't need any programming, but I I really think
for robust stuff, it's worth learning how to program a little bit. Uh even if it's in Excel, you gotta be able to test your ideas. So uh TradeStation I've used for many years. It's good for trading uh for testing out ideas on one security at a time, for testing out portfolios. Um it's not as strong. Uh I learned Amy Broker will be six years ago and and that
Very powerful. It can be a bit of a steep learning curve. Um, and you you you may need help in programming some things. And there are programmers available on the Amy Broker uh In the AMI broker forums. Software that I've started using in the last year is called RealTest. I like that a lot. I think it's very simple. as far as figuring out how to test things, and they've got some great example uh programs in there.
So I would probably start with real test if it was someone, but it you uh whatever it is, you gotta learn to test your ideas. Like you you want to know. that whatever edge you believe you have, you really have. Don't take anything at face value, even if you know it's it's true. You know, I used to I I used to say, I never believe anything I read about the market, even if I wrote it. Well then I guess in that case it's best for you uh not to read uh the news on the phone. What's right?
Well, then yeah. I mean, the news keeps you somewhat informed and uh but it doesn't really help a whole lot in trading. But I mean, even you know, studies I've written in the past, I don't believe that they're still true. I always go back and retest them. Mm-hmm. not doing what it's supposed to do for an extended period of time, you know, then it's time to consider getting out of the, you know, not trading it anymore. Right. But you know you won't know that unless you
go back and test. I'm actually working with someone now who wrote a a model many years ago and he asked me to take a look at it. He said, Well, I'll be surprised if uh if this and this and this happened And I said, Well I'll be surprised if you're not surprised when we look at some results. The first thing he did when we came back and said, Well, you were right. I was surprised. I didn't realize that this and this was going on.
¶ Journaling and Performance Review
You know, even if you feel like you know your edge, it's it's good to confirm it. One thing I did when I first started trading is, you know, I didn't have the ability to test everything, but I would write down the reason for each trade.
And I would track it in and I I used the portfolio accounting software I used to sell, but you could do it in Excel. It's very simple. You just this is this was my entry, this is my exit, this is what I made or lost on the trade. And this was the reason I took the trade. Right. And the reason was
you know, the uh the s whatever the whatever whatever the setup was called. So like it was a it was a Jeff Cooper setup. It could be a lizard or Gilligan's Island or whatever I was talking about. And if I didn't have a reason other than, you know, I thought it was going up or something, I'd I would write hunch.
And I would go back and look at my results and I could see, hey, these are actually these setups actually work better. And uh what I learned after not too long a time is the ones that I wrote hunch down next to, those were the worst. Well then that's a good uh good point for journaling, right?
But you got to journal in a way that you can actually go back and summarize your results, I would say at least in a spreadsheet, right? So add them all up. Um don't just journal is not just about writing about your feelings, right? You wanna You want to know the results um and be able to break it down in a in a quantitative way so that you can Understand where you're falling short and what you need to do, what systems are working for you, what systems aren't.
Um and they may come in and out of favor too. So if you know assistance has been great over the last, you know, fifteen years, don't throw it out because it's added rough two months. Right.
¶ Market Performance and Smooth Curves
Right. Well how how have the last uh few years of this choppy market been for you? So it's uh they've been interesting, right? So t uh twenty twenty one was easy. Um, that was a great year for me. And then 2022, it was split. So I had uh some models that really struggled. I had uh some models that did pretty well. And then the ones that did the best um were were the ones I mentioned earlier, the my VIX models that had a long volatility bias.
Right. So those are what uh kind of saved me last year. You know, and I I I had the ones that the one that really struggled for me last year was the one that traded trades treasuries. Right. So that's no big surprise. It's it's long only and it just switches from one duration to another. So go long duration, short duration. And it rotates that way. And every duration got killed last year. So
So that that hurt. And then this year's been a real strong year so far. Uh the the long volatility model has flattened out. So I haven't lost money on that. I haven't made much with it. But the other model uh have done uh quite well as either, you know, the like uh uh my trend model has done well and my um my swing trading models have have also done well. This they they uh And a couple of them did well last year.
But overall uh You know, the my curves uh these days are a lot smoother than they were, say, in 2008, 2009. uh even 2011 and 12 and 13, because I've got so much more uncorrelated going for me now than I did then. I I'm I'm not depending on one model to be, hey, this is the way I'm gonna trade now. Uh huh. I've got many different ways of trading now. Oh great. Anything that you're uh kind of working on now that you're excited about?
No, I uh you know the the the VIX stuff is is really the the the stuff that I'm I'm most excited about. I you know it's not just long vaul, I trade um the curve. So the VIX the VIX futures curve when it moves into I don't want to get too technical here, but sometimes it's upsloping, sometimes it's down sloping.
And um shifts in that curve are tradable beyond just saying, Hey, we're gonna get a spike in the VIX or we're gonna have the spic the the the VIX go down. When we get the spike, rather than saying, Hey, it's gonna go down. I can say, Hey, five month Vic's future is uh lower than the four month VIX future. And I think at some point over the next few months volatility is gonna revert so that or expectations will revert to the point where uh the future is more uncertain than
Then closer in in the present. Right. And that's generally when you look at the VIX futures curve, the farther out you look, the higher the price of the VIX future is. And that's because Six months from now, things are more uncertain than they are now. It inverts when something big happens, like Russia invades Ukraine. You see the VIX futures curve invert because there's all of a sudden lots of uncertainty in the market and people think, well, things will likely calm down
six months from now more than they are now. Um and so that's where you get that kind of unusual action. So I like trading the the curve, the shape of it as much as uh as trading, you know, up and down. It it's not always a directional move that I'm trading these days.
¶ Final Tips and Contact Information
Well, Rob, I want to thank you for coming on uh Chat With Traders. Sure. Um the the the one thing that I would suggest also for people if they're reading books. Start with real simple quant books. How markets really work by Larry Connors is a great one. And Brett Steenbarger, Daily Trading Coach, is another good one. Those are old but goodies. Great. Thanks for the tips. Thanks so much for having me, Ian. I really enjoyed getting to talk to you.
Yeah. Uh how can our listeners uh get in touch with you? quantifiable edges.com. So um you can you can email me at support at quantifiable ledges dot com or just on the website, you can check out some of the work I've done there. You can also get me at uh Capital Advisors 360. That's the the firm I work with as a registered investment advisor. Great. Fantastic. All right. Thank you. All right. Thank you very much.
You've reached the end of this episode of Chat with Traders, but rest assured there are more episodes. So to stay updated with each other. if you leave a rating.